Creating Charts within a Chart in Excel VBA
Recently I had to find a way to add multiple additional charts to an existing chart. The original chart is already created and setup by VBA, we just want to add two small charts at the bottom of this one chart object.
Earlier on in the program, the MyChart chart object has already been created:
Dim MyChart As Chart
Set MyChart = ThisWorkbook.Charts.Add
Now I need to re size it:
MyChart.PlotArea.Height = MyChart.PlotArea.Height * 0.75
The next step is to add the new chart. We settled on using a 3D pie chart due to the small available space – for this application, accurate interpretation of these specific parts wasn’t important. My early attempts at achieving this were to create a new chart, and then add it to the existing chart. But the easiest way I found was to add a chart to the MyChart shapes collection. A warning: if you’re running Office 2003, keep reading as the following won’t work. Here’s what it looks like:
'Define the chart
Dim NewChart As Shape
'Create it in the correct position
Set NewChart = MyChart.Shapes.AddChart(XlChartType.xl3DPie, 0, 300, 100, 100)
'And bind the datasource to it
NewChart.Chart.SetSourceData Source:=Sheets("DataSheet").Range("A1:B4")

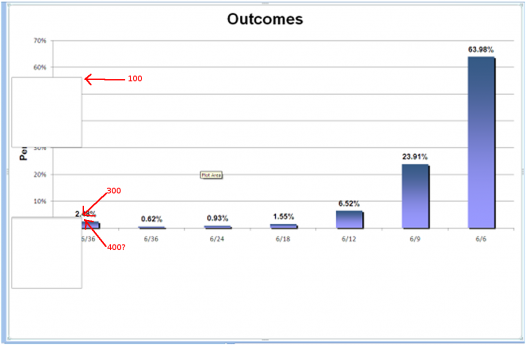
Creating an area for each new chart to sit in
300 is not actually the desired value; it’s just a way of testing that the method works as expected… which it doesn’t. When adding the new chart in this manner, it seems that it has to be contained inside the plot area of the original chart. However when you open the chart sheet and manually move the new chart, there is no problem! So let’s just create it first, than then move it into the correct position:
'move the chart to the bottom
NewChart.Top = MyChart.ChartArea.Height
'move the chart to a position off the center
NewChart.Left = MyChart.ChartArea.Width / 2 + 25
The next step is testing. Whenever your users actually see something, the fact that it works is not enough: it has to look good too! In Excel 2007 it already looks good without any additional formatting, however as many companies still use previous versions of Excel we should test it on 2003 too. Method not found! In Excel 2003, the CreateChart method did not exist, so we have to find another way that will at work on previous versions. In order to find this, I recorded a quick macro where I made a similar pie chart on an existing chart sheet and found that I can use the .Location method for a Chart:
Dim NewChart As Chart
Set NewChart = Charts.Add
NewChart.ChartType = xl3DPie
NewChart.SetSourceData Source:=Sheets("DataSheet").Range("A1:B4")
NewChart.Location xlLocationAsObject, MyChart.Name
If you step through the code, adding NewChart to the watch, you will notice that immediately after setting the location, the NewChart object loses its connection to the pie chart we are interested in! So the question is: where does it go? Since in 2007 when you want to add a chart directly to another ChartSheet you use the CreateChart method in the Shapes property, this is the first place to check. Adding it to watch, you see the number of Shapes contained in MyChart go from 0 to 1 directly after the .Location of NewChart is set. Now we just need to resize and reposition the new chart:
MyChart.Shapes(MyChart.Shapes.count).Width = 100
MyChart.Shapes(MyChart.Shapes.count).Height = 100
MyChart.Shapes(MyChart.Shapes.count).Top = MyChart.ChartArea.Height
MyChart.Shapes(MyChart.Shapes.count).Left = MyChart.ChartArea.Width / 2 + 25
Finally, we need to set the font so that it looks consistent on different versions of Office. Following is the complete code for the NewChart. Since we needed 2 charts, I created a sub to reduce repeated code.
Option Explicit
Sub OrigianalSub()
Dim MyChart As Chart
Set MyChart = ThisWorkbook.Charts.Add

''''' Other details on creating the MyChart object skipped '''''

MyChart.PlotArea.Height = MyChart.PlotArea.Height * 0.75

AddChart Sheets("DataSheet").Range("A1:B4"), -125, MyChart
AddChart Sheets("DataSheet").Range("A1:A4,C1:C4"), 25, MyChart

End Sub

Sub AddChart(Data As Range, Offset As Integer, VAChart As Chart)
Dim NewChart As Chart
Set NewChart = Charts.Add

With NewChart
.ChartType = xl3DPie
.SetSourceData Source:=Data
.Location xlLocationAsObject, MyChart.Name
End With

With MyChart.Shapes(MyChart.Shapes.count)
.Width = 100
.Height = 100
.Top = MyChart.ChartArea.Height
.Left = MyChart.ChartArea.Width / 2 + Offset
With .Chart
With .ChartTitle.Characters.Font
.Name = "Arial"
.FontStyle = "Bold"
.Size = 14
.ColorIndex = 1
End With

With .Legend.Font
.Name = "Arial"
.Size = 8
End With
End With
End With
End Sub

You should end up with a result like this, where the child charts sit neatly inside the parent

